6. Selection for a "total" phenotype leads to unique combinations of genes that result in equivalent fitnesses.
From a book about brain development in humans and mammal models, we get this complicated figure.
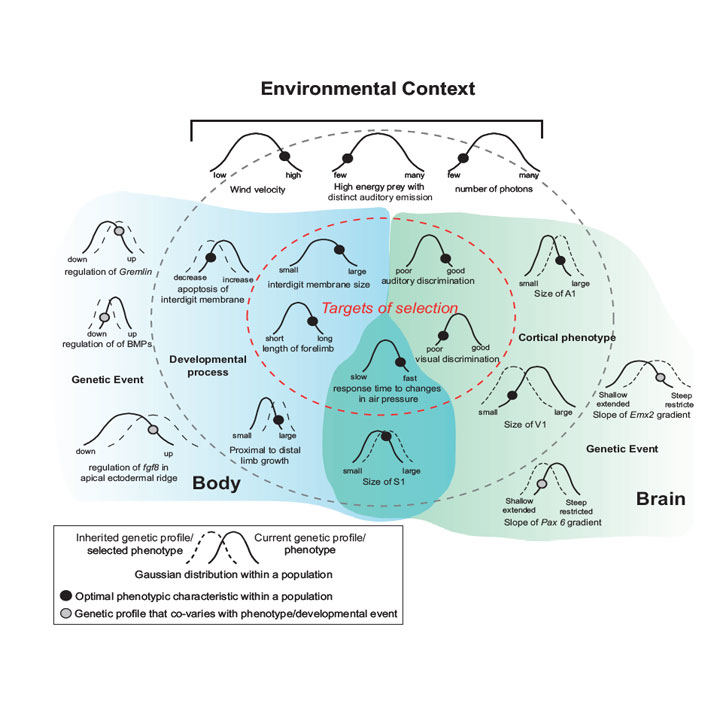
FIGURE 6.7 Schematic illustrating how genes, developmental processes, cortical phenotypes, and the targets of selection covary.
The Gaussian curves represent the range of naturally occurring variability in a specific characteristic, with narrower curves representing robust characteristics and wider curves representing stochastic characteristics. The black and gray circles represent the location of the optimal characteristic along the current distribution (solid curve). Selection pressures will eventually push the population to a new distribution, centered around the optimal characteristic (dashed curve). In this example our species is an echolocating bat and our environmental context (Top) has low light, high wind velocity, and a small number of high-value prey
items with restricted auditory emissions. Some of the targets of selection (Gaussian curves inside the innermost, dashed oval) would be characteristics of the forelimb that allow for flight such as the interdigit membranes with touch domes and the elongated portions of the forelimb. Additionally, behaviors such as fast response time and good auditory discrimination would be selected for. Visual discrimination ability would have a neutral effect in this context.
Cortical phenotypic characteristics (located between the dark gray and the innermost dashed lines) that underlie auditory and tactile discriminatory ability would include an increase in the size of S1 and A1, as well as an increase in the wing representation within S1. This latter cortical phenotype is related to the morphological and use-dependent changes to the limb. Underlying developmental processes associated with wing formation include a decrease in apoptosis in the interdigit membrane and the growth of the limb. At the far perimeter (Far Left and Far Right) of this illustration are the genetic events that covary with aspects of the body and brain phenotypes. For the brain this could include the gradient of transcription factors and changes in the boundaries of their downstream target genes (not shown). For the body this includes changes in the regulation of morphogens (e.g., down regulation of BMPs) and growth factors (upregulation of fgf8).
The light gray shading on the left corresponds to factors associated with the forelimb morphology, and the light gray shading on the right corresponds to factors associated with brain organization. These are not mutually exclusive but interact to some extent (overlapped shading). This illustration is a simplified version of the multiple layers of events that contribute to a phenotype characteristic that is the target of selection. However, it demonstrates how covariation between the targets of selection, phenotypic organization, and genetic events could lead to inheritance of genes that generate a population of future individuals with a unique combination of phenotypic characteristics.
Take home: What we believe selection is maximizing is changing as we learn more about "total" phenotypes, and the genes that act in concert to build these phenotypes and regulate them, especially only-transcribing genes and epigenetic controls.
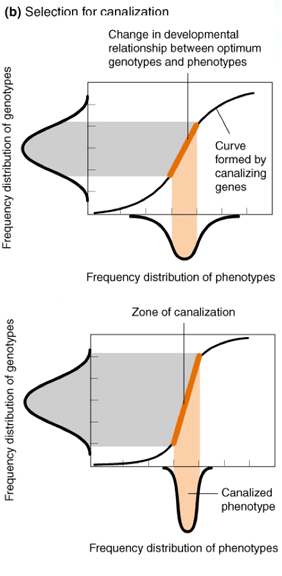
It's an updated take on canalization. This term is still used in many of today's articles on this topic.
Take home: Know what is meant by canalization.